Pimm Systems makes data analysis easy for everyone. Visualise key metrics, track performance, and discover trends without needing a data science background.
Create intuitive, custom dashboards to visualise your most important metrics. No coding or technical skills required.
Get the latest insights with real-time data refreshes. Stay on top of changes as they happen, keeping your team informed.
Set up automated reports to be delivered directly to your inbox. Save time and focus on making decisions, not creating reports.
Our team of skilled engineers can capture and monitor any data you require. Bespoke systems can be installed to analyse key areas within your business.
Always stay up-to-date with live data flowing directly into your dashboard. Track changes as they happen.
Tailor your dashboard to show the metrics that matter most. Create multiple views for different team members or purposes.
Bespoke tools tailored to your needs. We make custom sensors and code to help you monitor and capture needs within your business.
Save time with automated, scheduled reports. Get the insights you need.
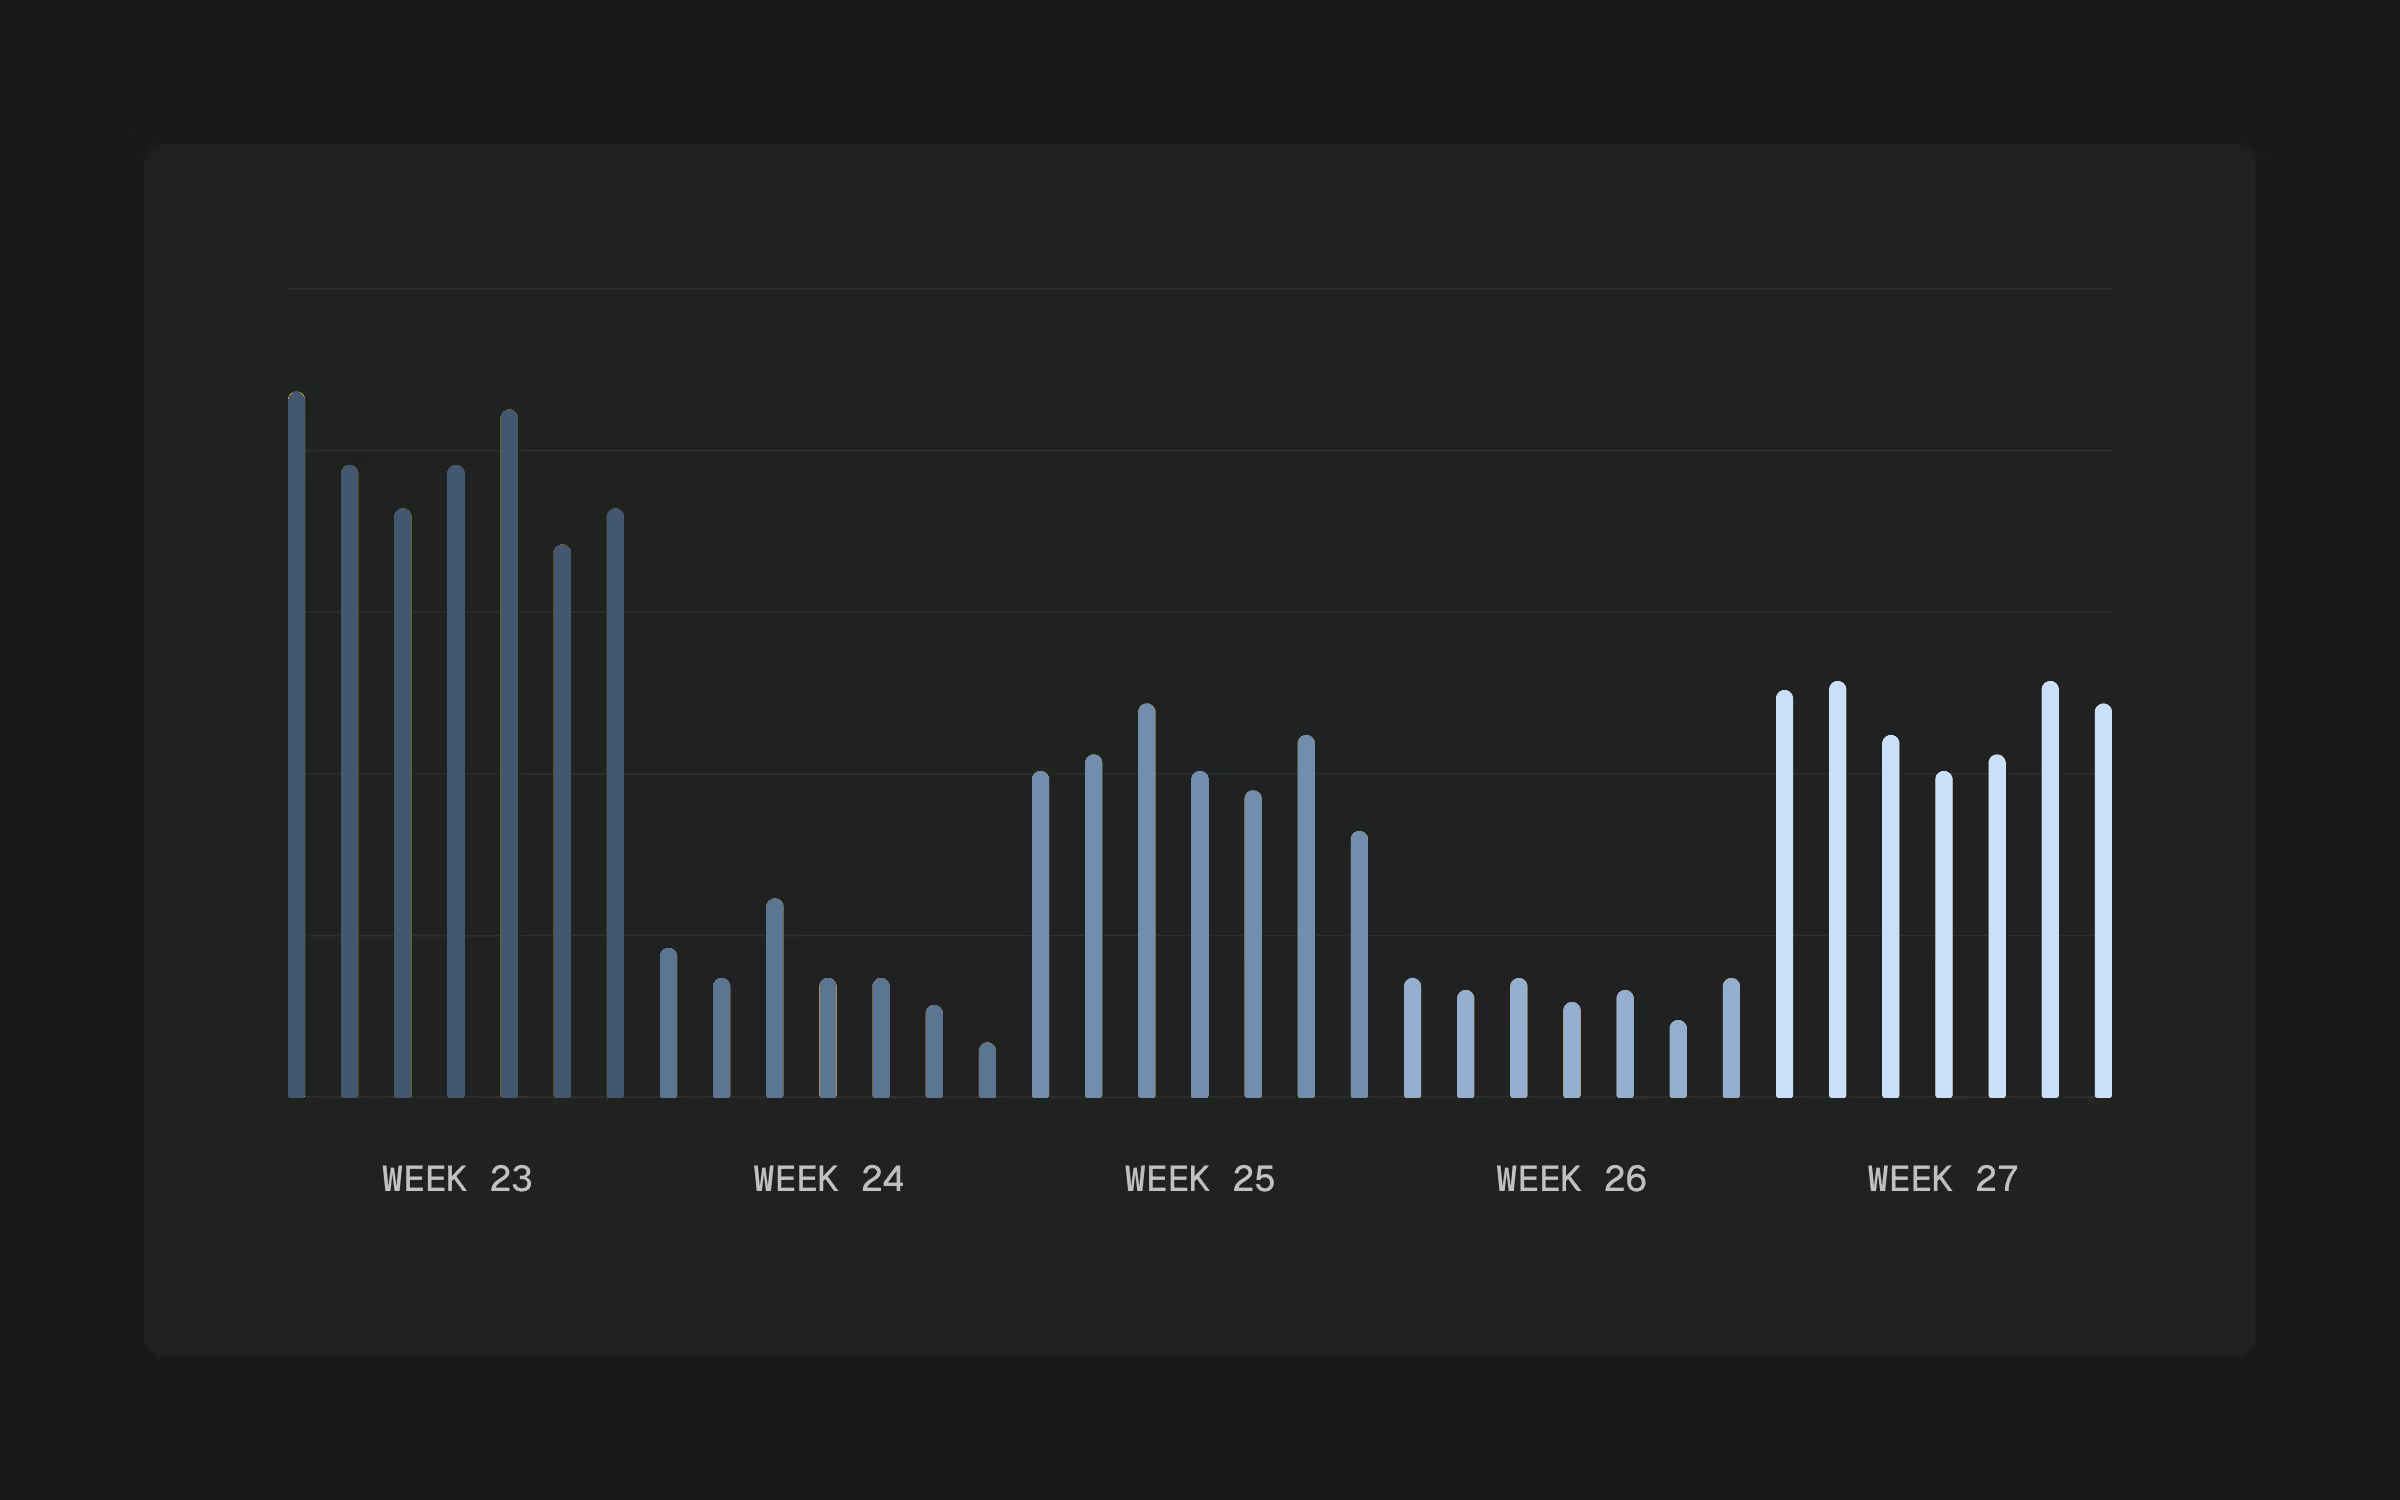
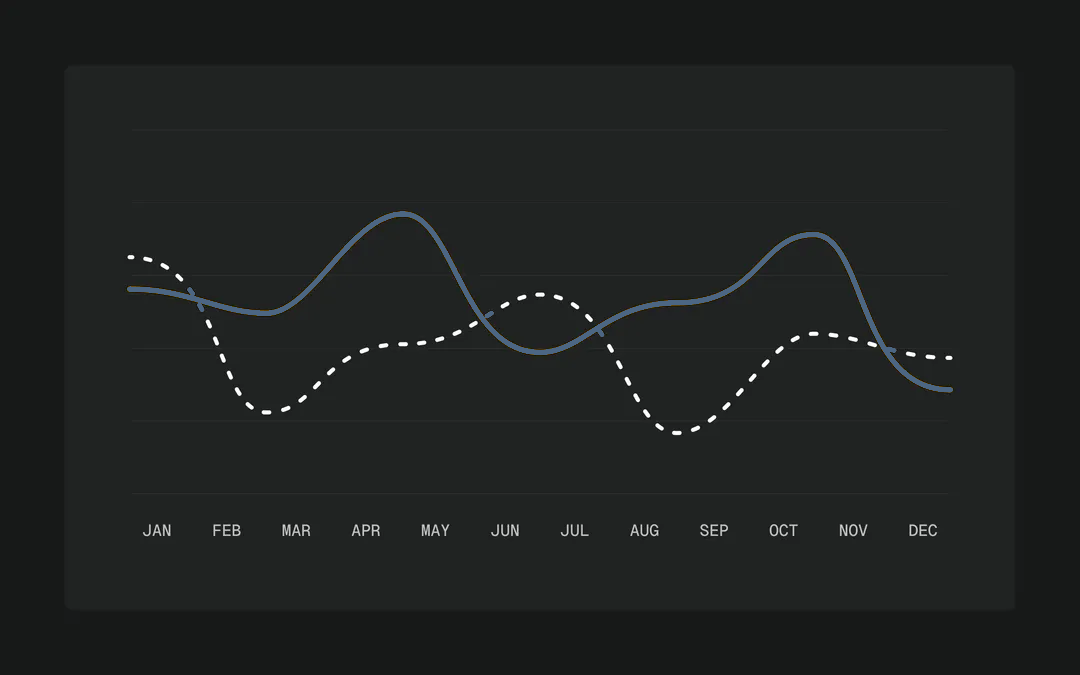
Discover patterns and trends in your data effortlessly. Visualise historical data to forecast future performance.
Dive deeper into your data with interactive charts. Hover and click for more detailed insights and breakdowns.
Answers to questions you might have about Pimm Systems.

Pimm Systems is a data analytics platform that helps businesses capture, visualise, and optimise their performance metrics in real-time. We enable teams to make data-driven decisions through customisable dashboards and powerful insights.
Pimm Systems is ideal for any growing business that wants to harness the power of their data. We're here for teams looking to improve their decision-making by tracking and pin-pointing key metrics across your business.
Security is our top priority. Pimm Systems use end-to-end encryption, secure data centres, and regular security audits to ensure your data is protected at all times.
Absolutely! Pimm System's interface is user-friendly and intuitive, designed for both technical and non-technical users. You can create custom reports, dashboards, and visualisations without any coding knowledge.